> ## Documentation Index
> Fetch the complete documentation index at: https://masaic-ai.mintlify.site/llms.txt
> Use this file to discover all available pages before exploring further.
# Observability
> Monitor and track performance of your OpenResponses deployment
# Observability
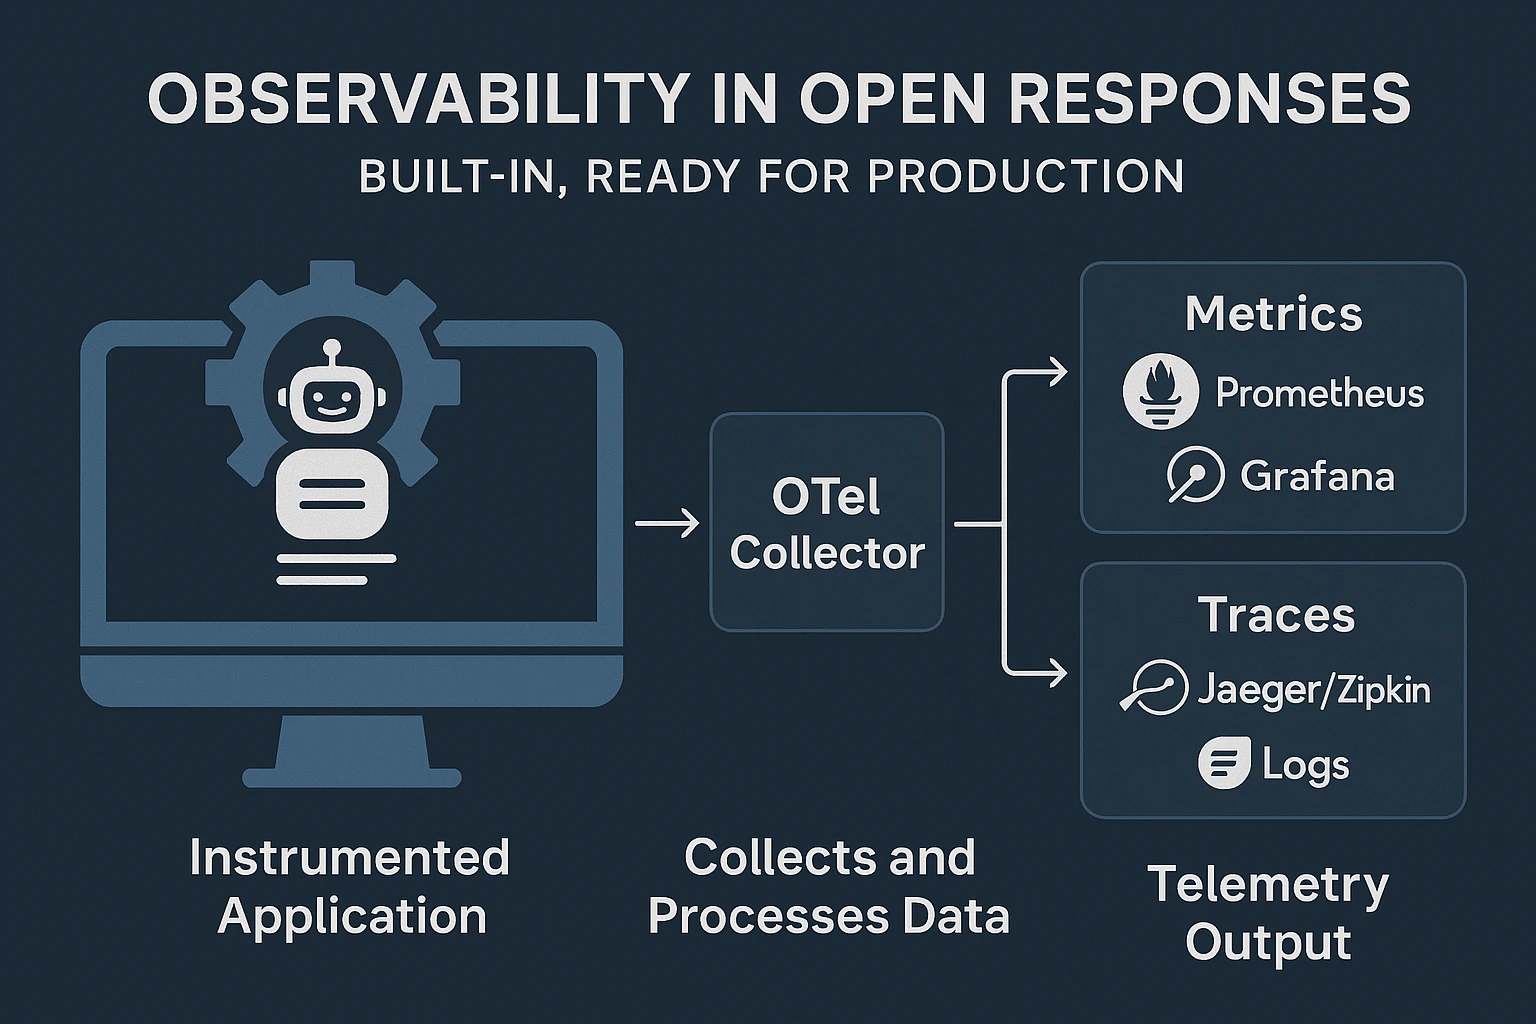
OpenResponses delivers enterprise-level observability out of the box, with zero configuration required to start collecting telemetry data across multiple dimensions.
 ## Production-Grade Observability
* **Launch and Monitor**: Start tracking critical GenAI metrics the moment your service goes live
* **No Instrumentation Burden**: Skip weeks of custom instrumentation work with pre-built telemetry
* **Immediate Insights**: Gain instant visibility into model performance, token usage, and system health
* **Scale with Confidence**: Production-ready monitoring that grows with your deployment
## Overview
OpenResponses uses OpenTelemetry standards to instrument:
1. Model API calls across all providers
2. Built-in tool executions
3. Message content (user, system, assistant, and choices)
4. Token usage metrics
5. Performance metrics for various operations
## Key Components
The primary component responsible for telemetry is the [`TelemetryService`](https://github.com/masaic-ai-platform/open-responses/blob/main/src/main/kotlin/ai/masaic/openresponses/api/support/service/TelemetryService.kt).
This service provides methods to:
* Create and manage observations (spans)
* Record metrics
* Emit GenAI-specific events
* Track token usage
## Metrics
You can view the collected metrics in any metrics tool (like Prometheus)
The system produces the following key metrics:
| Metric Name | Description |
| ---------------------------------- | -------------------------------------------- |
| `execute_tool` | Measures internal tool execution performance |
| `gen_ai_client_operation_duration` | Tracks duration of model API calls |
| `gen_ai_client_token_usage` | Counts input and output token usage |
## Traces
The system creates traces for:
1. HTTP POST requests to `/v1/responses` or `/chat/completions`
2. Model response generation via `{gen_ai.operation.name} {gen_ai.request.model}`
3. Built-in tool execution via `execute_tool`
## How to Export Telemetry Data
OpenResponses is designed to work with the OpenTelemetry ecosystem for exporting telemetry data to various backends.
### Setting Up the OpenTelemetry Collector
1. To enable the OpenTelemetry collector integration, start the service with:
```
OTEL_SDK_DISABLED=false
```
2. The OpenTelemetry collector collects data from the service using OTLP (OpenTelemetry Protocol).
3. Configuration of the collector is done via its config file, typically located in the deployment environment.
4. All opentelemetry [sdk-environment-variables](https://opentelemetry.io/docs/specs/otel/configuration/sdk-environment-variables/) are supported.
### Exporting to Monitoring Tools
The collected data can be shipped to various monitoring tools:
* **For Metrics**: Prometheus and Grafana
* **For Traces**: Jaeger, Zipkin, or other tracing backends
* **For Logs**: plug your own log aggregation systems
## Observability in Action
Below are some examples of the observability insights available in OpenResponses:
### Distributed Tracing with Conversation Logs
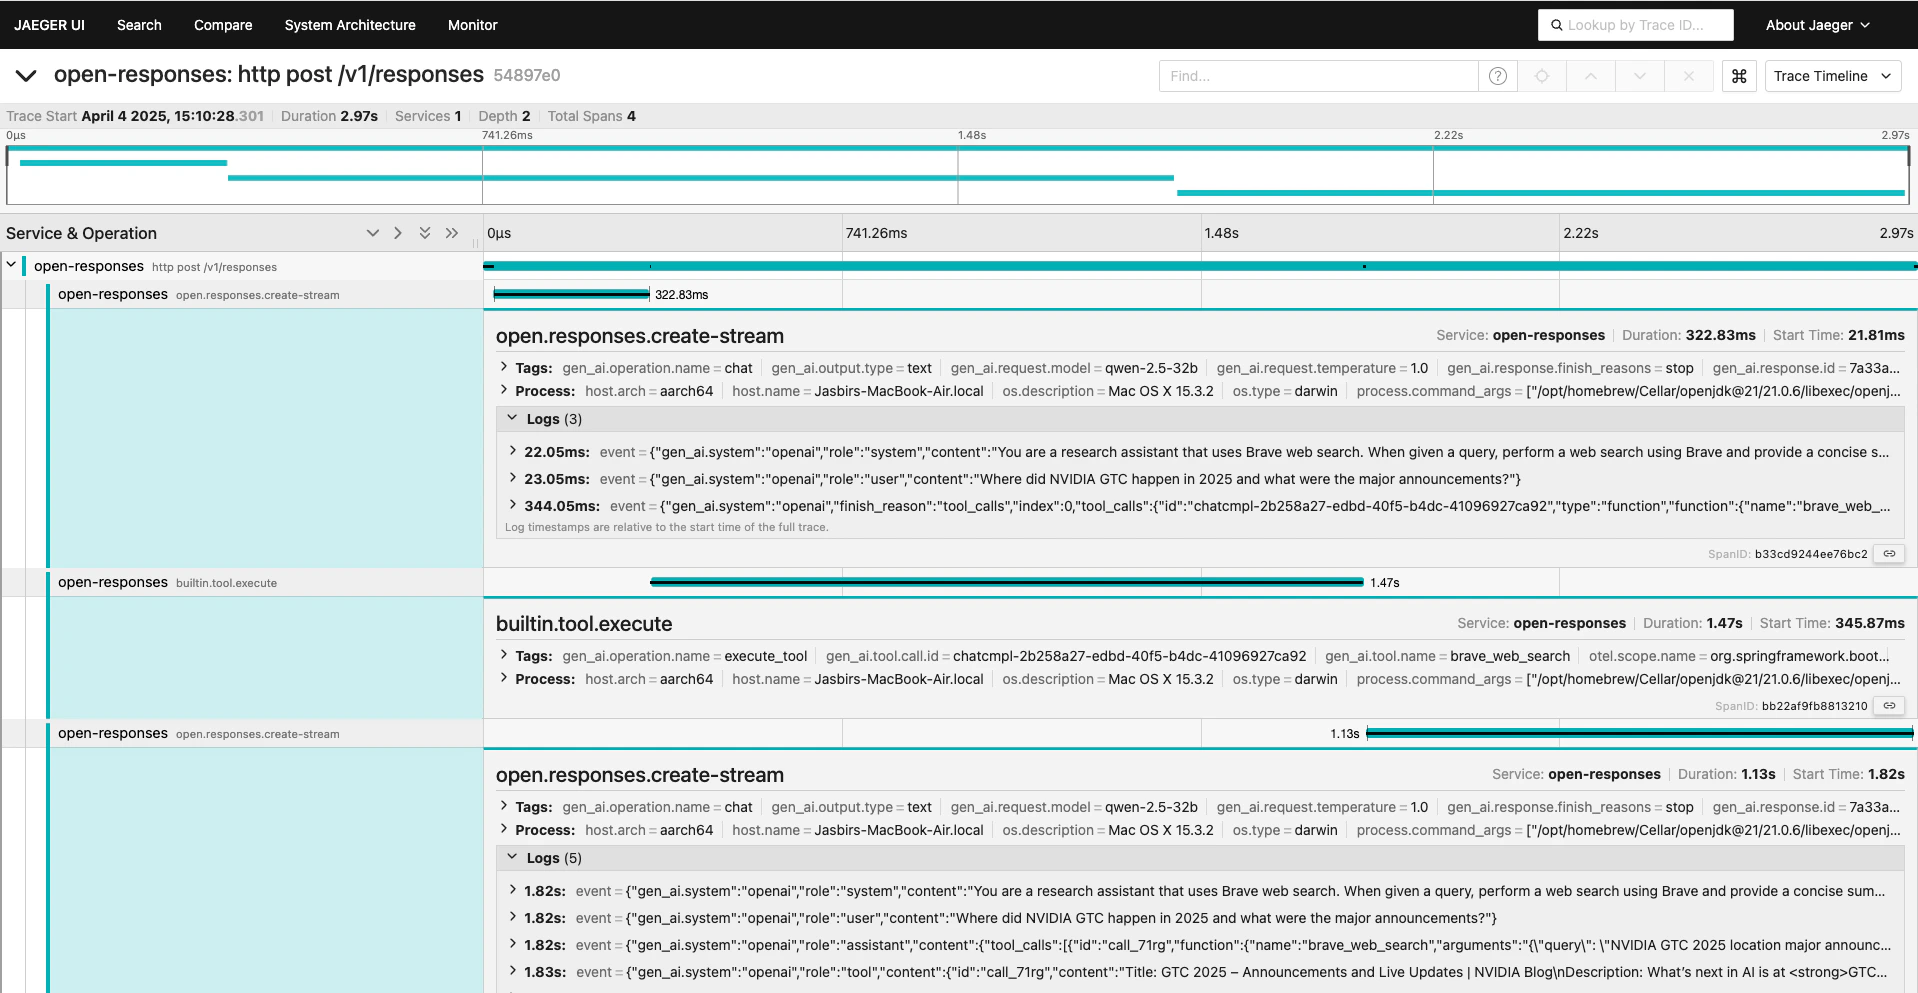
The following image shows distributed tracing of a Brave search agent with streaming, including the complete conversation logs:
## Production-Grade Observability
* **Launch and Monitor**: Start tracking critical GenAI metrics the moment your service goes live
* **No Instrumentation Burden**: Skip weeks of custom instrumentation work with pre-built telemetry
* **Immediate Insights**: Gain instant visibility into model performance, token usage, and system health
* **Scale with Confidence**: Production-ready monitoring that grows with your deployment
## Overview
OpenResponses uses OpenTelemetry standards to instrument:
1. Model API calls across all providers
2. Built-in tool executions
3. Message content (user, system, assistant, and choices)
4. Token usage metrics
5. Performance metrics for various operations
## Key Components
The primary component responsible for telemetry is the [`TelemetryService`](https://github.com/masaic-ai-platform/open-responses/blob/main/src/main/kotlin/ai/masaic/openresponses/api/support/service/TelemetryService.kt).
This service provides methods to:
* Create and manage observations (spans)
* Record metrics
* Emit GenAI-specific events
* Track token usage
## Metrics
You can view the collected metrics in any metrics tool (like Prometheus)
The system produces the following key metrics:
| Metric Name | Description |
| ---------------------------------- | -------------------------------------------- |
| `execute_tool` | Measures internal tool execution performance |
| `gen_ai_client_operation_duration` | Tracks duration of model API calls |
| `gen_ai_client_token_usage` | Counts input and output token usage |
## Traces
The system creates traces for:
1. HTTP POST requests to `/v1/responses` or `/chat/completions`
2. Model response generation via `{gen_ai.operation.name} {gen_ai.request.model}`
3. Built-in tool execution via `execute_tool`
## How to Export Telemetry Data
OpenResponses is designed to work with the OpenTelemetry ecosystem for exporting telemetry data to various backends.
### Setting Up the OpenTelemetry Collector
1. To enable the OpenTelemetry collector integration, start the service with:
```
OTEL_SDK_DISABLED=false
```
2. The OpenTelemetry collector collects data from the service using OTLP (OpenTelemetry Protocol).
3. Configuration of the collector is done via its config file, typically located in the deployment environment.
4. All opentelemetry [sdk-environment-variables](https://opentelemetry.io/docs/specs/otel/configuration/sdk-environment-variables/) are supported.
### Exporting to Monitoring Tools
The collected data can be shipped to various monitoring tools:
* **For Metrics**: Prometheus and Grafana
* **For Traces**: Jaeger, Zipkin, or other tracing backends
* **For Logs**: plug your own log aggregation systems
## Observability in Action
Below are some examples of the observability insights available in OpenResponses:
### Distributed Tracing with Conversation Logs
The following image shows distributed tracing of a Brave search agent with streaming, including the complete conversation logs:
 ### GenAI Performance Metrics
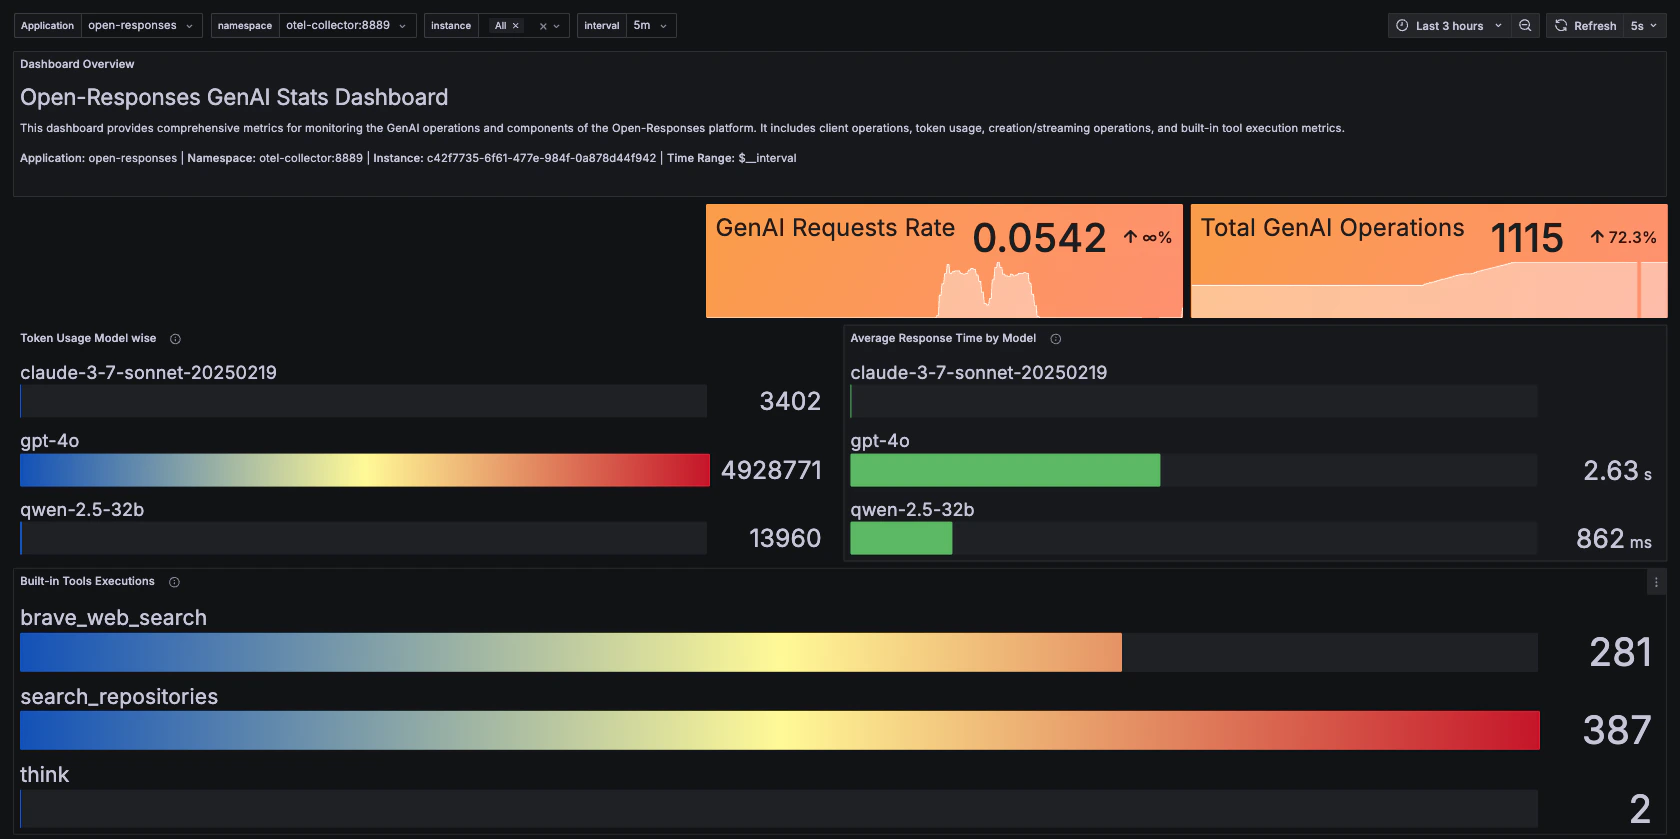
This dashboard displays token usage and model performance metrics:
### GenAI Performance Metrics
This dashboard displays token usage and model performance metrics:
 ### System Health Monitoring
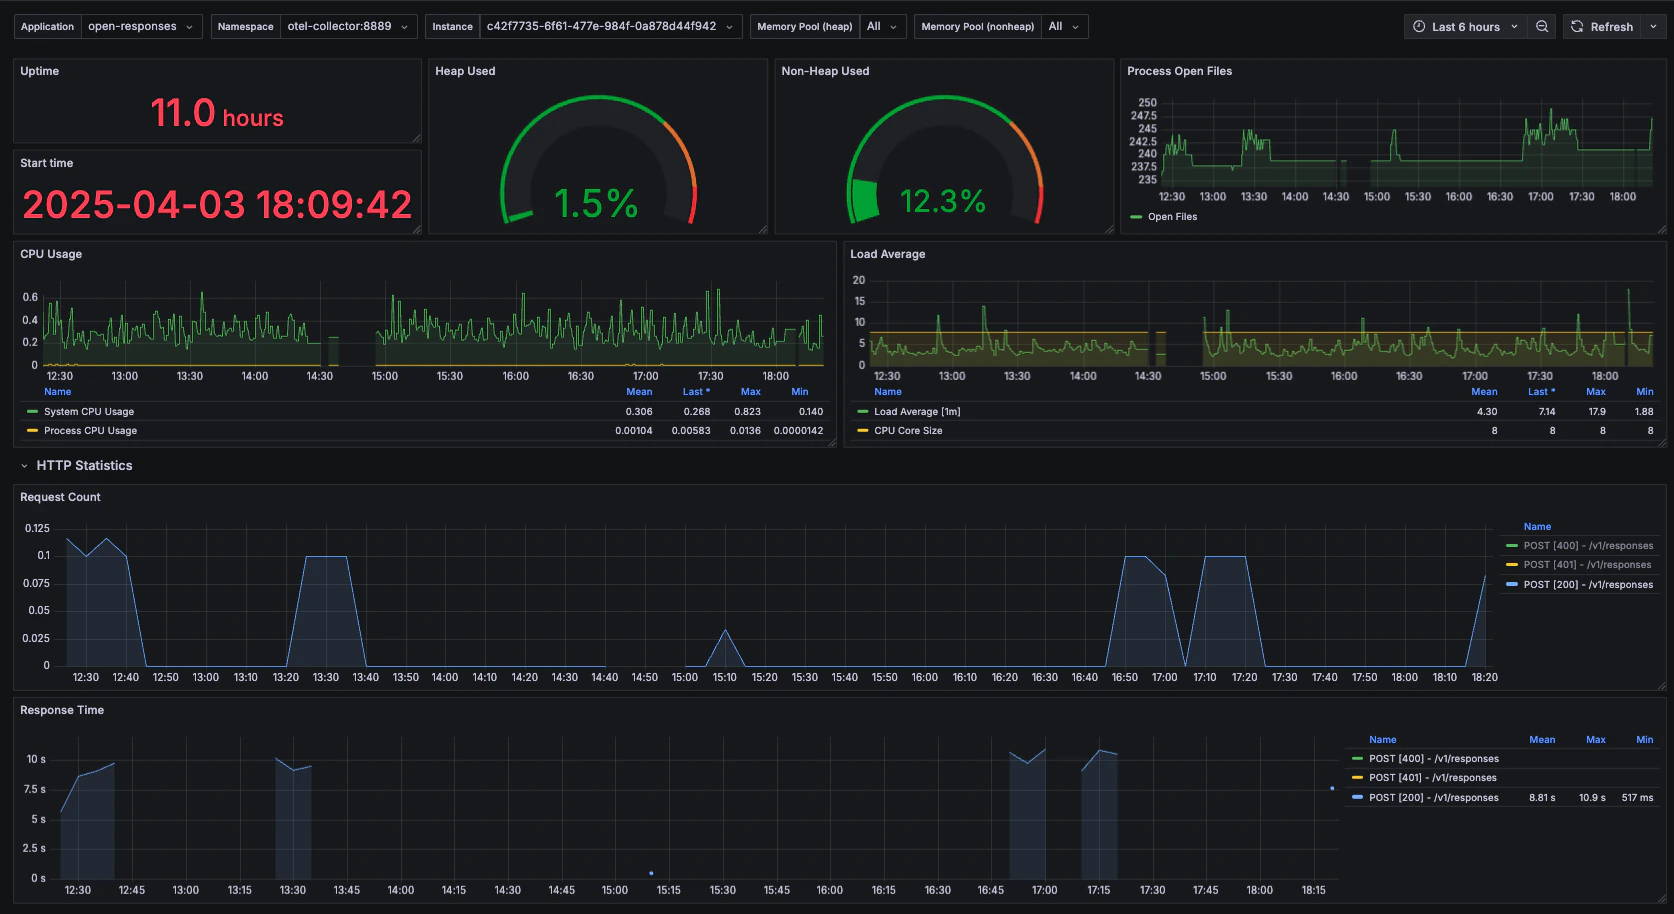
Monitor the overall health and performance of your OpenResponses service:
### System Health Monitoring
Monitor the overall health and performance of your OpenResponses service:
 ## Standard Metrics
In addition to GenAI-specific observability, OpenResponses emits standard Spring Boot metrics, including:
* JVM statistics (memory usage, garbage collection)
* HTTP request metrics (response times, error rates)
* System metrics (CPU usage, disk I/O)
* Logging metrics
* Thread pool statistics
These metrics provide a holistic view of the application's performance beyond just the AI model interactions.
## OpenTelemetry Compatibility \[WIP: For complete compliance with OTEL Specs]
The built-in observability system in OpenResponses follows opentelemetry specifications. This allows you to:
* Use SigNoz, Jaeger, or Dynatrace for distributed tracing
* Implement Prometheus and Grafana for metrics and dashboards
* Integrate with OpenTelemetry-compatible GenAI evaluation stacks like LangFuse
This flexibility ensures that OpenResponses can fit into your existing observability infrastructure without requiring proprietary monitoring solutions.
## OpenTelemetry Compliance
The implementation follows OpenTelemetry specifications for:
* Spans: [GenAI Agent Spans](https://opentelemetry.io/docs/specs/semconv/gen-ai/gen-ai-agent-spans/)
* Metrics: [GenAI Metrics](https://opentelemetry.io/docs/specs/semconv/gen-ai/gen-ai-metrics/)
* Events: [GenAI Events](https://opentelemetry.io/docs/specs/semconv/gen-ai/gen-ai-events/)
This ensures compatibility with standard observability tools and dashboards that support OpenTelemetry.
## OpenTelemetry span attributes that are under implementation are:
1. gen\_ai.request.choice.count
2. gen\_ai.request.seed
3. gen\_ai.request.frequency\_penalty
4. gen\_ai.request.presence\_penalty
5. gen\_ai.request.stop\_sequences
6. gen\_ai.request.top\_k
## Standard Metrics
In addition to GenAI-specific observability, OpenResponses emits standard Spring Boot metrics, including:
* JVM statistics (memory usage, garbage collection)
* HTTP request metrics (response times, error rates)
* System metrics (CPU usage, disk I/O)
* Logging metrics
* Thread pool statistics
These metrics provide a holistic view of the application's performance beyond just the AI model interactions.
## OpenTelemetry Compatibility \[WIP: For complete compliance with OTEL Specs]
The built-in observability system in OpenResponses follows opentelemetry specifications. This allows you to:
* Use SigNoz, Jaeger, or Dynatrace for distributed tracing
* Implement Prometheus and Grafana for metrics and dashboards
* Integrate with OpenTelemetry-compatible GenAI evaluation stacks like LangFuse
This flexibility ensures that OpenResponses can fit into your existing observability infrastructure without requiring proprietary monitoring solutions.
## OpenTelemetry Compliance
The implementation follows OpenTelemetry specifications for:
* Spans: [GenAI Agent Spans](https://opentelemetry.io/docs/specs/semconv/gen-ai/gen-ai-agent-spans/)
* Metrics: [GenAI Metrics](https://opentelemetry.io/docs/specs/semconv/gen-ai/gen-ai-metrics/)
* Events: [GenAI Events](https://opentelemetry.io/docs/specs/semconv/gen-ai/gen-ai-events/)
This ensures compatibility with standard observability tools and dashboards that support OpenTelemetry.
## OpenTelemetry span attributes that are under implementation are:
1. gen\_ai.request.choice.count
2. gen\_ai.request.seed
3. gen\_ai.request.frequency\_penalty
4. gen\_ai.request.presence\_penalty
5. gen\_ai.request.stop\_sequences
6. gen\_ai.request.top\_k