Running Open Responses with Observability Stack
This guide provides step-by-step instructions for running the Open Responses service with the observability stack, which includes OpenTelemetry, Jaeger, Prometheus, and Grafana.Steps to Run Open Responses with Observability
-
Navigate to the observability infrastructure directory:
-
Start the observability stack:
This will run the following services:
- OpenTelemetry Collector
- Jaeger
- Prometheus
- Grafana
-
Navigate back to open-responses directory. Run Open Responses service with OpenTelemetry enabled:
-
Note: You might see momentary exceptions like this for spans, logs and metrics.
This is normal during startup. Note: by default setup do not configure log exporter in otel-collector. Feel free to connect your favourite logging system.
- Once all services are running properly, these errors should disappear.
-
Access the observability services through your browser:
- Jaeger UI: http://localhost:16686/
- Prometheus: http://localhost:9090/
- Grafana: http://localhost:3000/
-
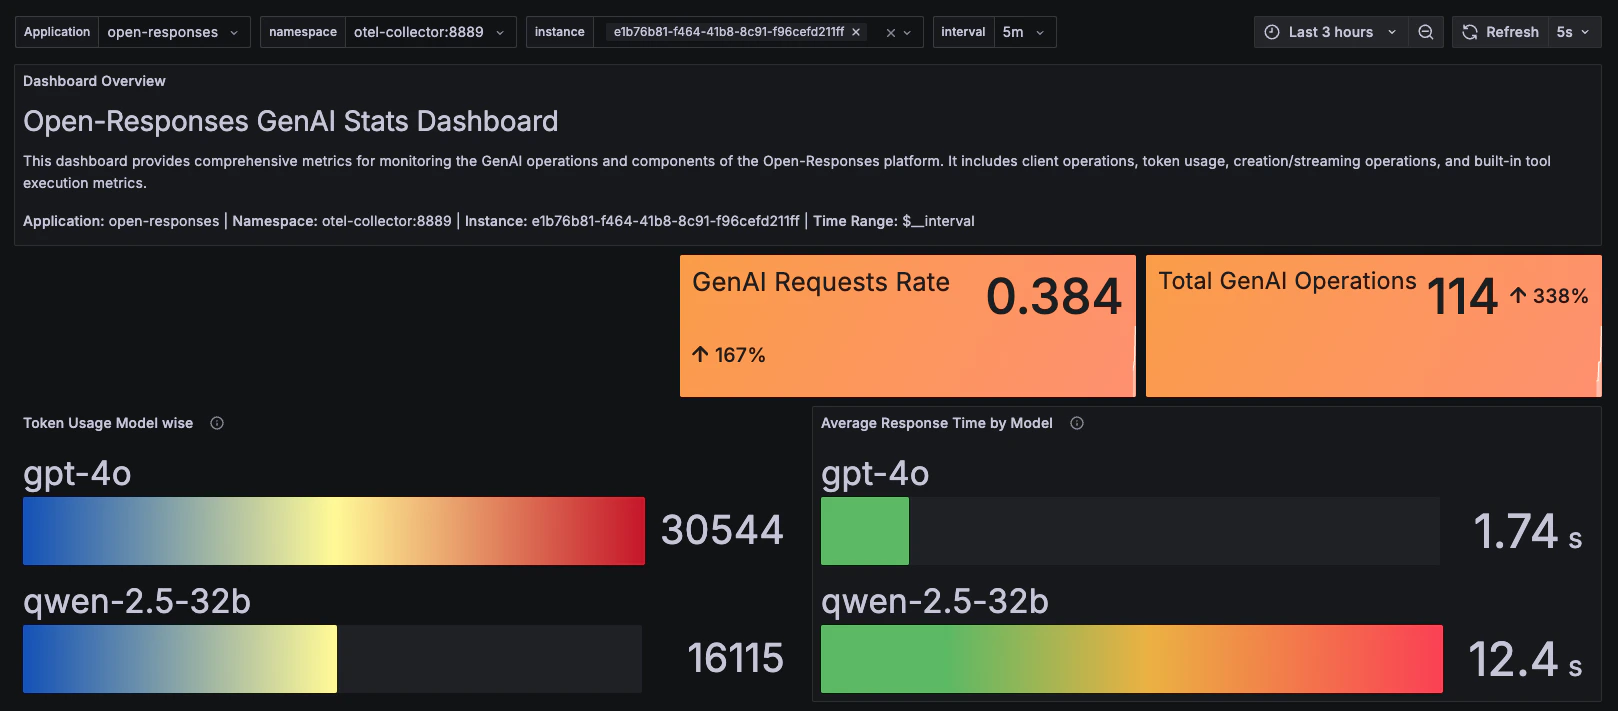
Grafana comes pre-loaded with production-ready dashboards in the folder ‘Open Responses’ at http://localhost:3000/dashboards. These include:
- Open-Responses GenAI Stats: Contains generative AI performance and usage metrics
- Open-Responses Service Stats: Contains service compute level metrics like CPU, memory usage, etc.
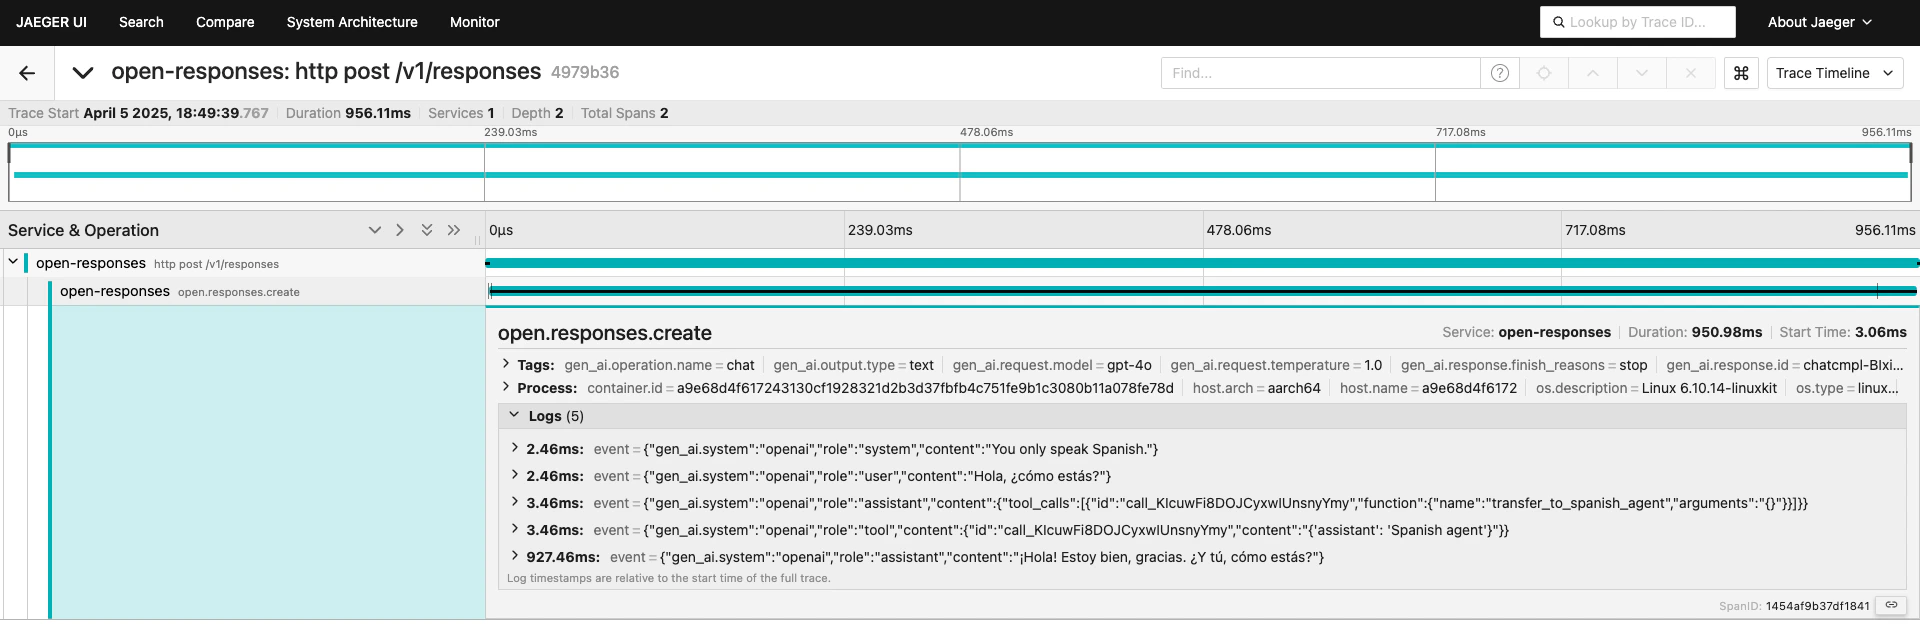
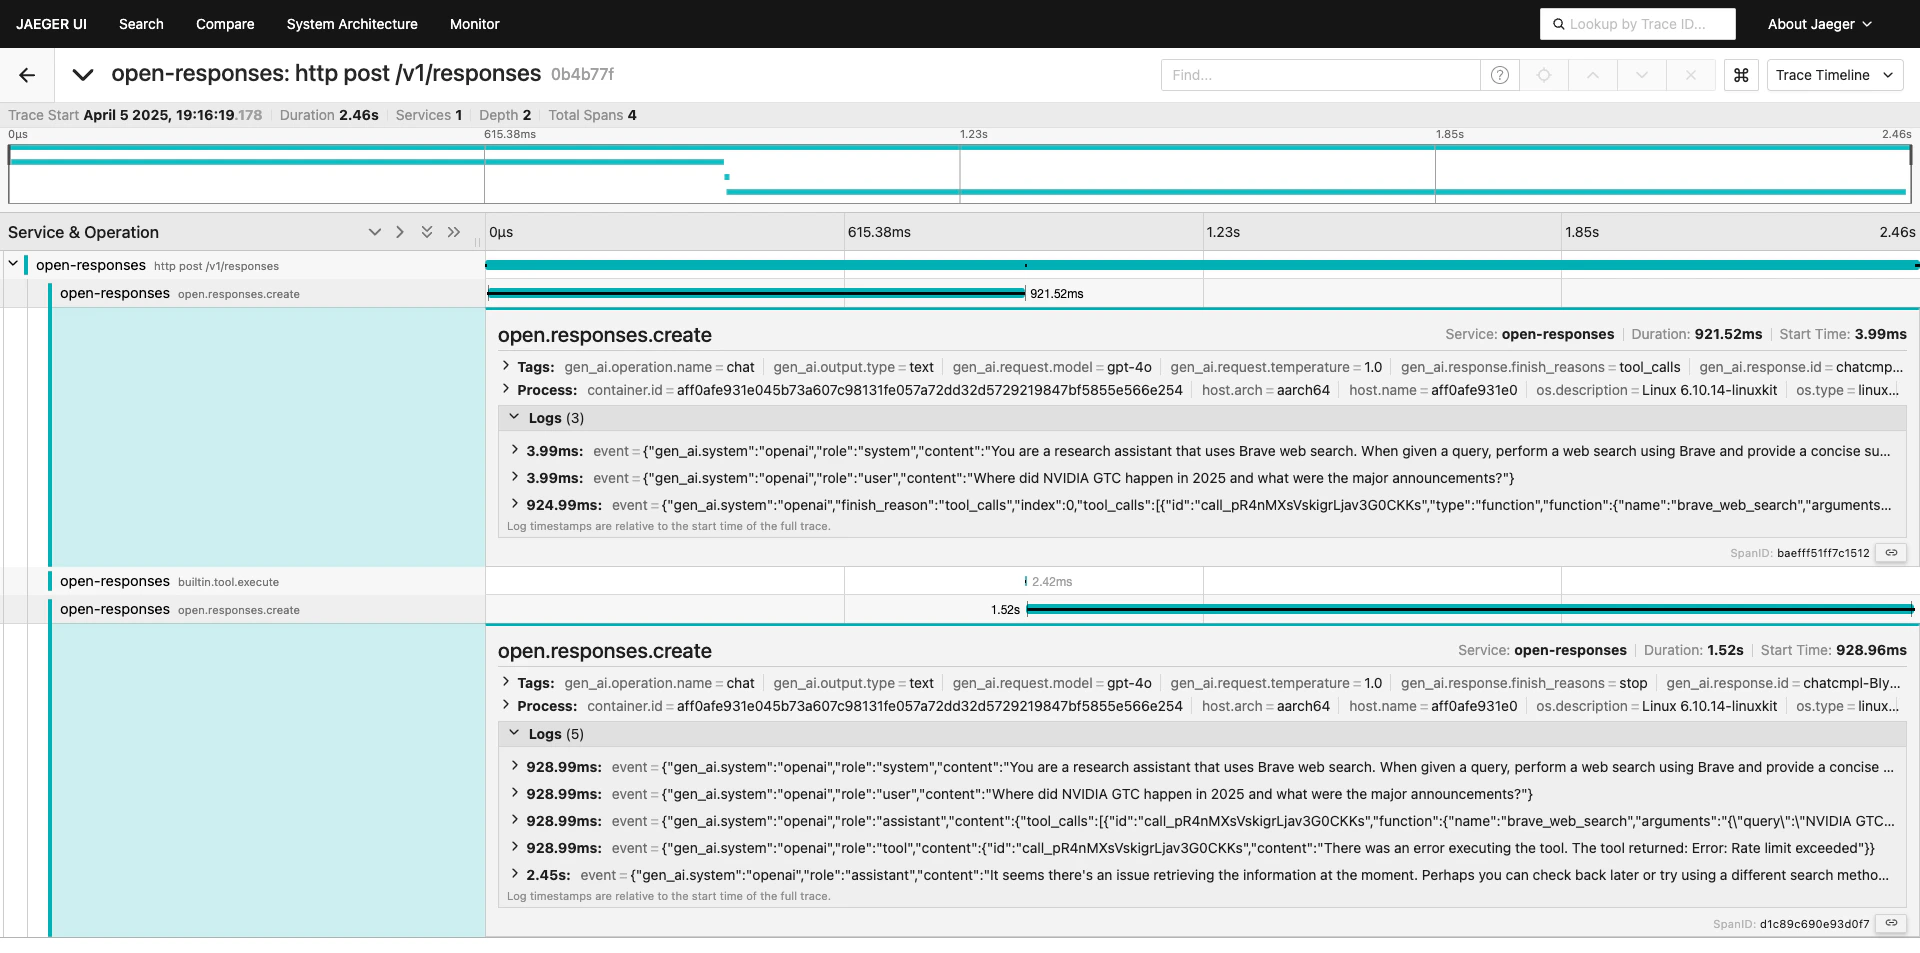
- Run few times any of the curl examples mentioned in the Quickstart guide to generate data. You should see statistics in the Grafana dashboards and traces in Jaeger.
- You can also run examples from the OpenAI Agent SDK by following the instructions in the Quickstart guide.
-
To generate enough datapoints for meaningful dashboard visualization, you can use the load generation examples available at: OpenAI Agents Python Examples
Prerequisites:
- The service should be running as described in step #3
- At least one model provider key is set (GROQ_API_KEY, OPENAI_API_KEY, or CLAUDE_API_KEY)
-
Simple agent load generation:
You can choose the model provider of your choice (groq, openai, claude).
-
Brave search agent load generation (if brave_web_search MCP tool is configured):
You can choose the model provider of your choice (groq, openai, claude).
Observability in Action
The overall Prometheus state during load generation is shown below: